From Breadboard to First Data: Debugging, Enclosures & a Test Drive
🎧 Listen to Build, Create & Learn — A Maker’s Journey Episode 6 for the full story behind this blog post.
Moving Beyond the Breadboard
After Episode 5, I thought I was nearly ready for a drone test flight. My Feather RP2040 was logging both BME280 and GPS data to an SD card, and it all worked beautifully on the breadboard. The next step seemed simple: put everything into an enclosure, add a battery, and take it airborne.
Oh boy, how far I was from reality.
As soon as I started planning the enclosure, I realized: pin headers and jumper wires wouldn’t cut it. For anything flight-ready, the boards needed to be connected with proper wires — and that meant desoldering the headers.
Removing the Pin Headers
This step turned out to be more painful than expected. I first tried removing whole rows of headers with my soldering iron. No luck. Even with plenty of flux, the boards refused to cooperate.
The trick that worked for me came from a YouTube tip: cut the headers into single pins, remove the plastic spacer, and then desolder them one by one. Slow and tedious, but it got the job done.
Unfortunately, I was a bit heavy-handed. Some pads on my Feather RP2040 and breakout boards ended up torn or weakened — issues that came back to haunt me during debugging.

Wrestling with the “Helping Hand”
Another frustration was holding the boards in place while desoldering. My cheap “helping hand” tool was wobbly and collapsed under the slightest pressure.
For delicate soldering, it’s fine — but when you need to apply force, it’s useless. This made me realize how much I’d value a more stable, professional mounting solution for electronics work. (Something I might design myself in the future.)
Designing the Enclosure
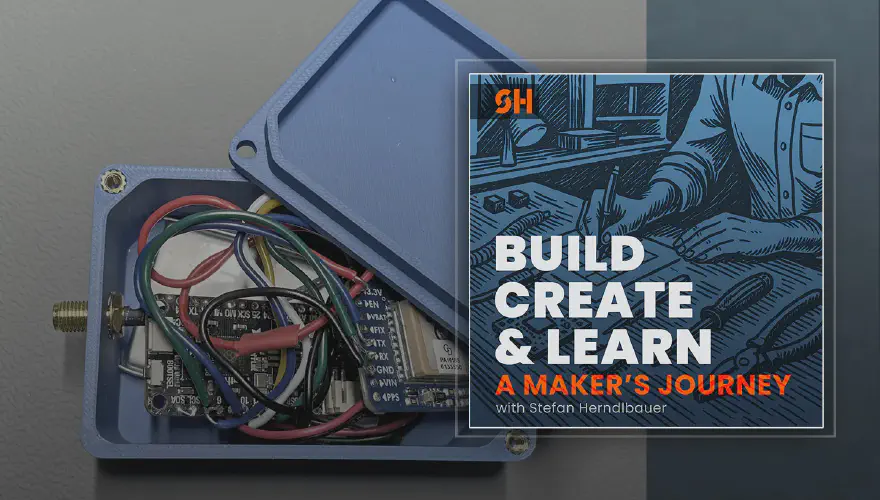
Since my breakout boards have mounting holes, I scrapped my first idea of stacking them on standoffs. Instead, I went with a simpler rectangular box: 80×50×30 mm with a friction-fit lid and screws in two corners.
No hinge, no fancy locking — just a tight fit. I modeled the case in CAD, printed a few test versions, and was surprised how quickly it came together.

Debugging the Wiring
With the boards desoldered and rewired using 22 AWG solid core wires, I reconnected everything exactly as on the breadboard: Feather RP2040, BME280, microSD, and GPS. At least, that was the plan.
The SD card immediately threw an error:
OSError: no SD card
I checked all solder joints, reflowed them with flux, and tested continuity with a multimeter. Everything looked fine. Then I spotted it: the pad for GPIO18 (intended for the SD clock) on the Feather looked damaged. The wire wasn’t making a reliable connection.
The fix was rerouting SPI to alternate pins (D10/D11/D12). Suddenly, the SD initialized and worked again.
Next came the BME280, which returned:
ValueError: No I2C device at address
The I²C bus scan came back empty. Again, I measured voltages, reflowed joints, and even suspected the sensor board itself. Hours of frustration later, I shelved it and moved on to the GPS.
The GPS at first showed only zeros in the CSV log. The culprit? Another torn pad on the Feather’s UART pins. Rewiring it to UART1 finally gave me back clean NMEA strings — and a working GPS fix.
This entire debugging cycle taught me a painful but important lesson: next time, I’ll use perfboards with pin sockets rather than desoldering breakout headers. Much safer.
First Test Drive
The weather was too rainy for a drone test flight, so I mounted the device in the car and took it for a short 5 km drive.
With the external antenna connected and the blue LED indicating a fix, I logged data the whole way — while watching the car’s speedometer closely to later compare it with the logged speed data.
Back home, I pulled the SD card, opened the CSV, and there it was: altitude, speed, and coordinates all neatly logged. The first real-world dataset from my homemade telemetry logger.
Visualizing the Data
Raw numbers are nice, but maps and plots make it real. In JupyterLab, I loaded the CSV, cleaned it up, and used Folium to overlay the GPS track on OpenStreetMap tiles. Seeing my short drive appear on a real map was incredibly satisfying.
I also added two more plots:
- Speed over time — compared directly against the car’s speedometer.
- Altitude over time — noisy, but still fascinating.
import math
from pathlib import Path
import pandas as pd
import folium
from folium.plugins import MousePosition
import matplotlib.pyplot as plt
import gpxpy, gpxpy.gpx

# Make pandas show more
pd.set_option("display.max_columns", None)
csv_path = Path(r"data.csv") # Point this to your copied log file from the SD card
df = pd.read_csv(csv_path)

# Parse types
df["datetime_utc"] = pd.to_datetime(df["datetime_utc"], errors="coerce")
for col in ["lat","lon","spd_kmh","alt_gps_m","hdop","sats","fix_q"]:
    if col in df.columns:
        df[col] = pd.to_numeric(df[col], errors="coerce")

# Keep valid rows and sort
df = df.dropna(subset=["lat","lon"])
df = df[(df["lat"].between(-90, 90)) & (df["lon"].between(-180, 180))]
df = df.sort_values("datetime_utc")
df.head()
assert not df.empty, "No valid lat/lon rows."

lat0, lon0 = df.iloc[0][["lat","lon"]]
m = folium.Map(location=[lat0, lon0], zoom_start=14, control_scale=True, tiles="OpenStreetMap")

# Speed color function (0 km/h = blue, 120 km/h = red)
def color_for(v, vmin=0, vmax=120):
    if pd.isna(v): v = 0
    t = max(0, min(1, (v - vmin) / (vmax - vmin + 1e-9)))
    r = int(255 * t); g = 0; b = int(255 * (1 - t))
    return f"#{r:02x}{g:02x}{b:02x}"

coords = df[["lat","lon","spd_kmh"]].to_numpy()
for i in range(len(coords)-1):
    (la1,lo1,s1),(la2,lo2,s2) = coords[i], coords[i+1]
    c = color_for((0 if pd.isna(s1) else s1 + 0 if pd.isna(s2) else s2)/2)
    folium.PolyLine([(la1,lo1),(la2,lo2)], color=c, weight=4, opacity=0.9).add_to(m)

# Start/Finish markers
folium.Marker([df.iloc[0].lat, df.iloc[0].lon], tooltip="Start", icon=folium.Icon(color="green")).add_to(m)
folium.Marker([df.iloc[-1].lat, df.iloc[-1].lon], tooltip="Finish", icon=folium.Icon(color="red")).add_to(m)

MousePosition(position="topright", separator=" | ", prefix="Lat/Lon").add_to(m)

m  # Show in notebook

out_html = csv_path.with_suffix("").with_name(csv_path.stem + "_map.html")
m.save(str(out_html))
out_html
plt.figure(figsize=(10,3))
plt.plot(df["datetime_utc"], df["spd_kmh"].fillna(0))
plt.xlabel("Time (UTC)")
plt.ylabel("Speed (km/h)")
plt.title("Speed over time")
plt.tight_layout()

# Altitude over time plot
plt.figure(figsize=(10,3))
plt.plot(df["datetime_utc"], df["alt_gps_m"], color="purple")
plt.xlabel("Time (UTC)")
plt.ylabel("Altitude (m)")
plt.title("GPS Altitude over Time")
plt.tight_layout()

gpx = gpxpy.gpx.GPX()
trk = gpxpy.gpx.GPXTrack(); gpx.tracks.append(trk)
seg = gpxpy.gpx.GPXTrackSegment(); trk.segments.append(seg)

for _, row in df.iterrows():
    seg.points.append(gpxpy.gpx.GPXTrackPoint(
        float(row.lat), float(row.lon),
        elevation=None if pd.isna(row.get("alt_gps_m", float("nan"))) else float(row["alt_gps_m"]),
        time=None if pd.isna(row["datetime_utc"]) else pd.Timestamp(row["datetime_utc"]).to_pydatetime()
    ))

out_gpx = csv_path.with_suffix(".gpx")
with open(out_gpx, "w", encoding="utf-8") as f:
    f.write(gpx.to_xml())
out_gpx
Finally, I exported the track as a GPX file and visualized it in GPX Studio and Google Earth. For a 5 km car ride, the accuracy was surprisingly good — even if altitude and speed showed some fluctuation.

Next Steps
This phase felt like a true milestone: from breadboard to a working prototype with real logged data.
Next on my list:
- Fix the BME280 wiring and bring back environmental data
- Optimize the enclosure for drone mounting
- Add battery level monitoring
- Experiment with LoRa communication for long-range telemetry
And of course, the big one: the first real drone test flight.
📬 Want weekly behind-the-scenes updates from my workbench (projects that don’t always make it to the podcast)? Subscribe to my Maker’s Logbook newsletter.
Let’s keep building, creating, and learning — together.
You may also like
From Zero to Flight-Ready: Logging Data with CircuitPython on the Feather RP2040
Build, Create & Learn — A Maker’s Journey Episode 5 you’ll know that in the last Episode I decided to pivot my drone telemetry project to CircuitPython on the Adafruit Feather RP2040.
When the SD Card Won: Why I Switched to CircuitPython for My Drone Telemetry Project
Build, Create & Learn — A Maker’s Journey Episode 4. I’m happy to share the latest updates of my projects in my new podcast episode.
A Maker’s Journey – Episode 3: Untethered Embedded & GPS Adventures
Build, Create & Learn — A Maker’s Journey Episode 3. I’m happy to share the latest updates of my projects in my new podcast episode.